Accounts Payable Dashboard Reports
Last updated: September 22, 2026
Overview
The Account Payable dashboard (shown as Accounts Payable in the sidebar) tracks outstanding bills, payment obligations, and accounts payable performance. It's under Reports → Dashboards → Accounts Payable.
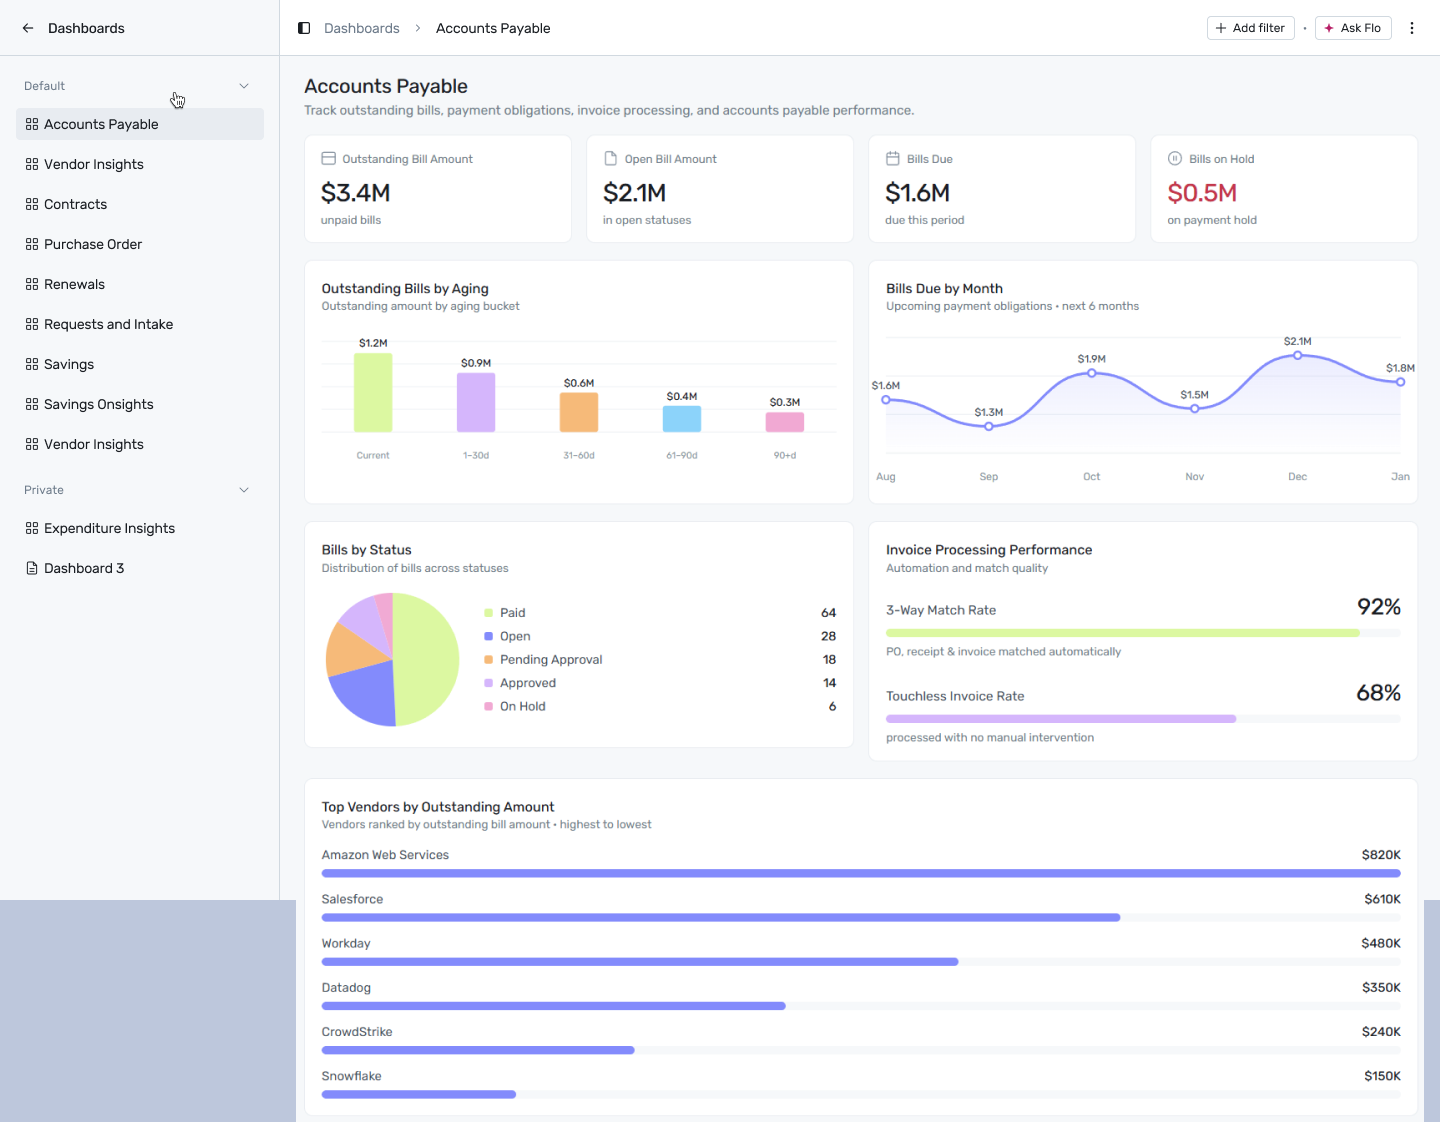
Reports → Dashboards → Accounts Payable
Filtering
Click + Add filter to narrow this dashboard by:
Date — applies to Outstanding Bills by Aging, Bills Due by Month, and Top Vendors by Outstanding Amount.
Department — not currently supported by any report on this dashboard.
A filter only affects the widgets whose report declares that dimension — anything else is left unchanged.
Reports on this dashboard
Outstanding Bill Amount
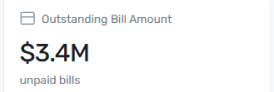
The total value of unpaid bills right now, across every status. This is your single headline AP exposure number — everything else on this dashboard breaks it down by age, status, or vendor.
Open Bill Amount
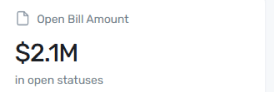
The portion of bills sitting in open statuses specifically, rather than the full outstanding total. Compare it against Outstanding Bill Amount to see how much of what you owe is actively moving through the process versus sitting elsewhere (on hold, pending approval, and so on).
Bills Due
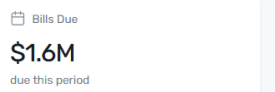
The amount due within the current period. Use this as your near-term cash-outflow number — what you actually need to pay soon, as opposed to the full outstanding balance.
Bills on Hold
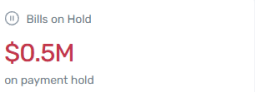
The amount currently on payment hold. A rising figure here is worth investigating on its own — bills get held for a reason (a dispute, a missing approval, a data issue), and a growing hold balance usually means something upstream needs attention.
Outstanding Bills by Aging
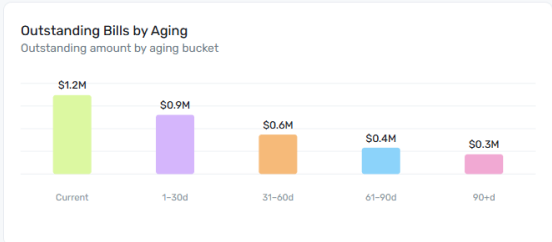
Buckets outstanding bill amount by how overdue it is — Current, 1–30d, 31–60d, 61–90d, or 90+d. The further right the weight of the bars sits, the more of your outstanding balance is genuinely aged rather than simply recent — a heavy 90+d bucket is the clearest sign of a collections or payment-process problem.
Bills Due by Month
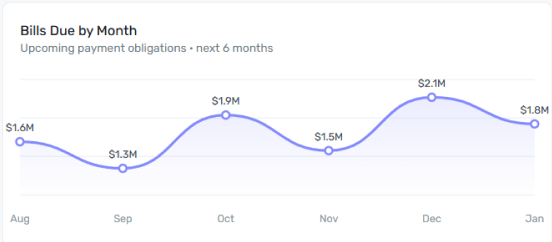
A line chart forecasting payment obligations over the next six months. Use this for cash-flow planning — a rising line heading into a particular month flags a period where outgoing payments will spike.
Bills by Status
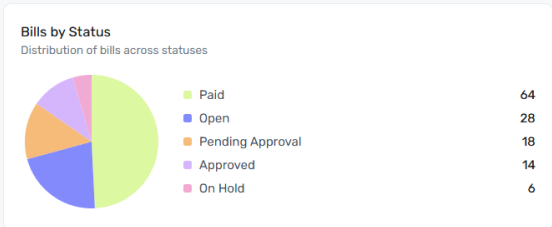
A pie chart of bill counts by status — Paid, Open, Pending Approval, Approved, or On Hold. This is a count breakdown, not an amount breakdown, so it tells you how many bills are stuck at each stage rather than how much money is involved.
Top Vendors by Outstanding Amount
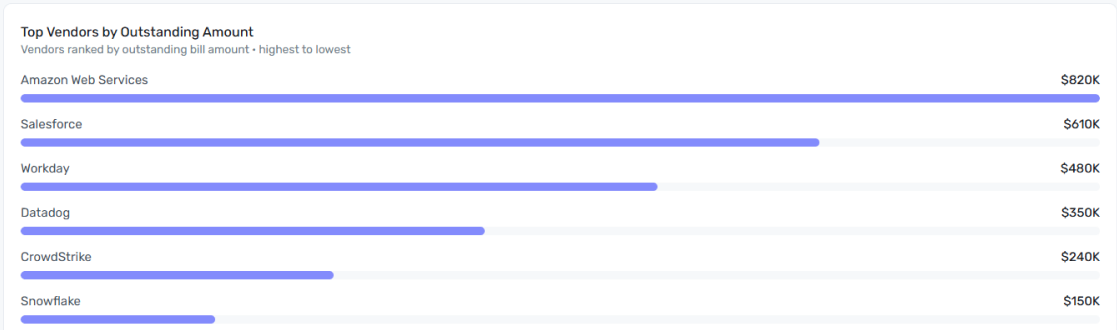
Ranks vendors by how much you currently owe them, highest to lowest. This is your prioritization list for AP follow-up — the vendors at the top represent both your biggest payment obligations and, if anything is overdue, your biggest relationship risk if payment slips further.