Requests Overview Dashboard Reports
Last updated: September 22, 2026
Overview
The Requests dashboard (shown as Requests Overview in the sidebar) monitors request volume, approval backlog, and SLA performance across your procurement workflows. It's under Reports → Dashboards → Requests Overview.
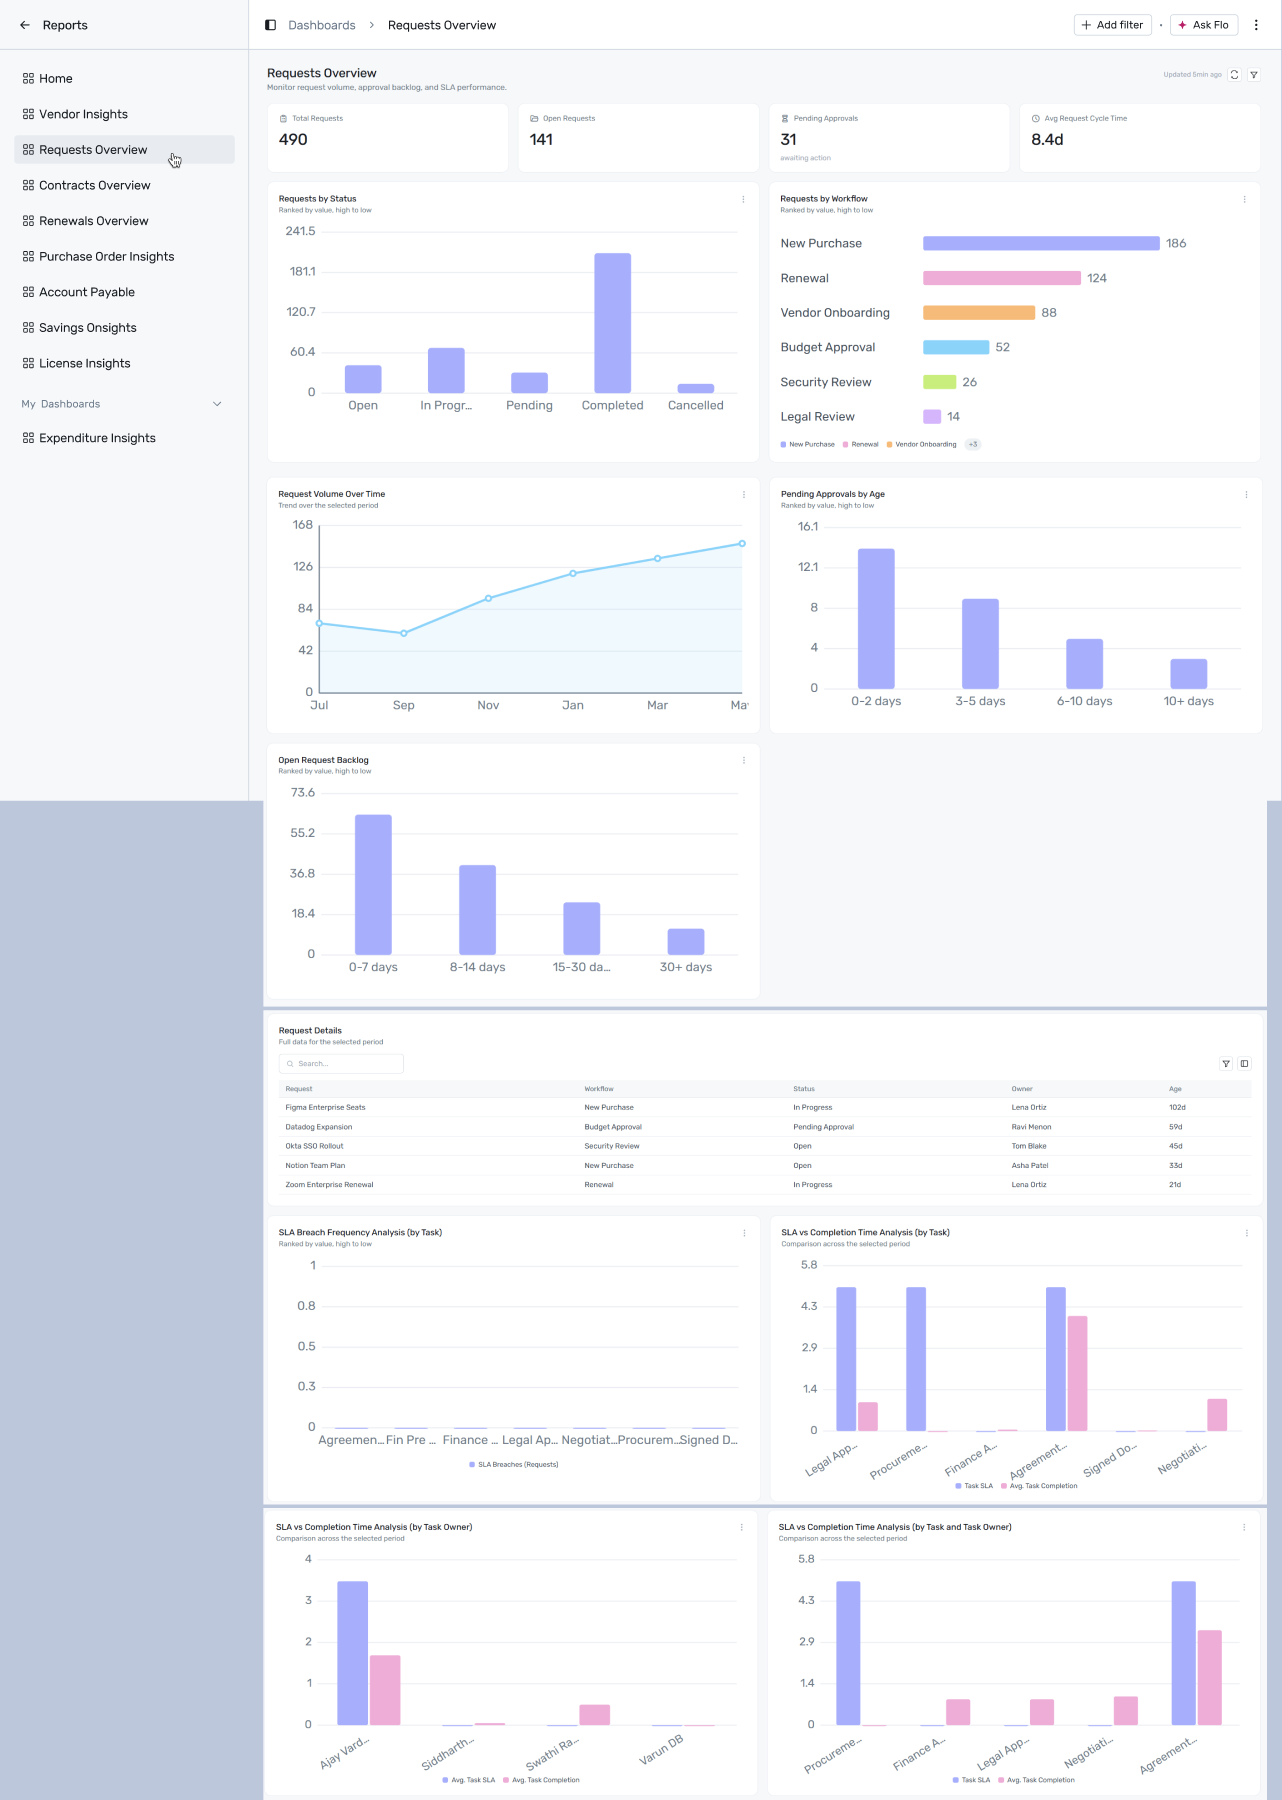
Reports → Dashboards → Requests Overview
Filtering
Click + Add filter to narrow this dashboard by:
Date — applies to Request Volume Over Time and the age/backlog-based reports.
Department — applies to Total Requests, Open Requests, Avg Request Cycle Time, Requests by Status, Requests by Workflow, Request Volume Over Time, Open Request Backlog, and Request Details.
A filter only affects the widgets whose report declares that dimension — anything else is left unchanged.
Reports on this dashboard
Total Requests
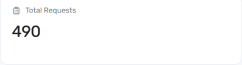
The total count of requests raised in the selected period, across every workflow. This is your baseline volume number — track it over time to see whether intake is growing faster than your team's capacity to process it.
Open Requests
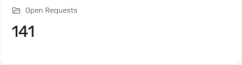
The count of requests currently in flight — anything not yet closed. Compare this against Total Requests to get a rough sense of what share of incoming work is still unresolved at any given moment.
Pending Approvals
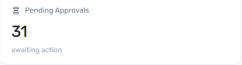
The count of approval tasks currently awaiting action from someone. This is a live "what's stuck on a person right now" number, distinct from Open Requests, which counts whole requests rather than individual pending approval steps.
Avg Request Cycle Time
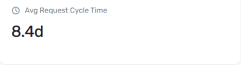
The average number of days from a request being created to it closing. A rising number here means requests are taking longer to complete on average, even if volume hasn't changed — worth checking against Requests by Workflow to see if a particular workflow is dragging the average up.
Requests by Status
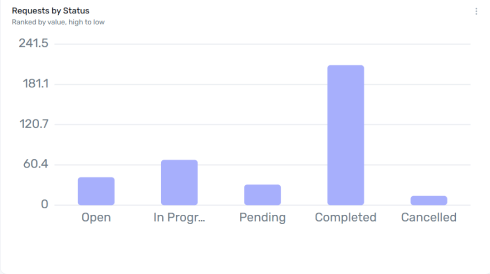
Counts requests by their current status — Open, In Progress, Pending, Completed, or Cancelled. Use this to see where in the process most of your requests currently sit; a large Pending bar alongside a small Completed one suggests requests are queuing up rather than moving through.
Requests by Workflow
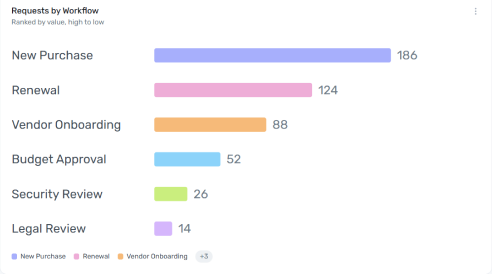
Ranks workflow types — New Purchase, Renewal, Vendor Onboarding, Budget Approval, Security Review, Legal Review — by how many requests went through each. This tells you which kind of work is actually driving your request volume, which is useful context before reading the SLA/task reports further down, since they break down performance by task rather than by workflow.
Request Volume Over Time
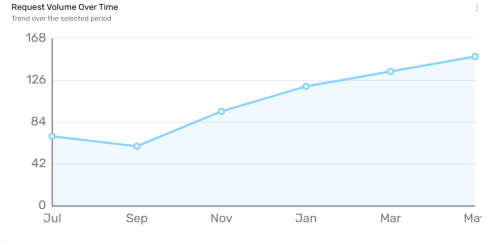
A line chart of requests received each month over the trailing period. Use the trend direction, not any single month's value — a steadily climbing line means intake is growing and it may be time to revisit staffing or automation for the busiest workflows.
Pending Approvals by Age
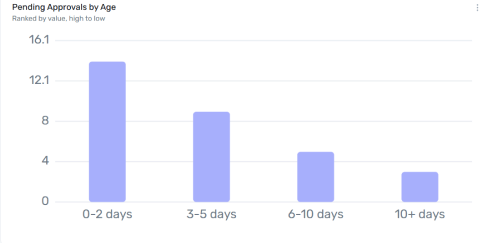
Buckets pending approval tasks by how long they've been waiting — 0–2, 3–5, 6–10, or 10+ days. A heavy 10+ bucket points to approvals that are being neglected rather than just queued, and is usually worth a direct nudge to the approver rather than a process fix.
Open Request Backlog
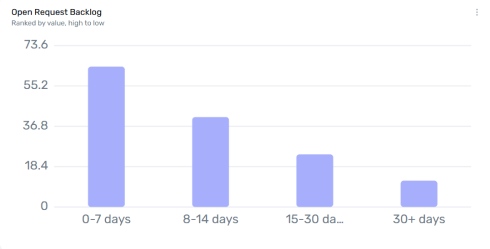
Buckets open requests by age — 0–7, 8–14, 15–30, or 30+ days. This is the request-level equivalent of Pending Approvals by Age: the further right the weight sits, the more your backlog is made up of genuinely old requests rather than ones that just came in.
Request Details

A row-per-request table of open and in-progress requests, oldest first — request name, workflow, status, owner, and age in days. Use this when a chart tells you there's a problem (a big Pending bar, a heavy 30+ day bucket) and you need to know exactly which requests and owners are behind it.
SLA Breach Frequency Analysis (by Task)
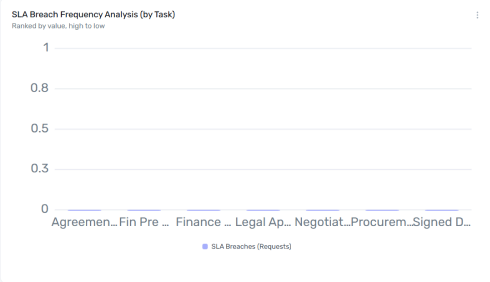
Counts how many requests breached their SLA, broken down by task (Agreement Creation, Finance Approval, Legal Approval, Negotiations, Procurement Completion, and others). A task with a consistently non-zero bar is a recurring bottleneck worth addressing directly, rather than something that just varies request to request. Report-level filter: Version.
SLA vs Completion Time Analysis (by Task)
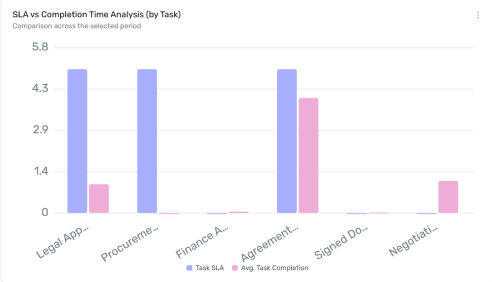
For each task, compares the target SLA against the average actual completion time, as two bars side by side. Where the actual-completion bar is taller than the SLA bar, that task is consistently running over its target — where it's shorter or missing, the task is comfortably within SLA. Report-level filter: Version.
SLA vs Completion Time Analysis (by Task Owner)
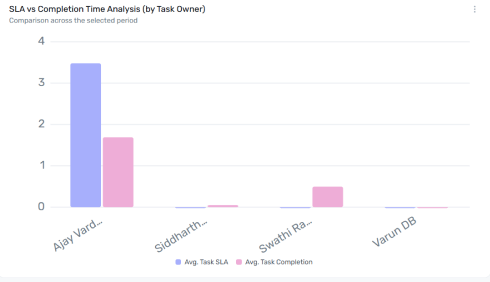
The same SLA-vs-actual comparison, but grouped by the person completing the task instead of the task itself. Use this to see whether an SLA problem is really a task-design problem (everyone struggles with it) or an individual workload/training issue (one owner is consistently over, others aren't). Report-level filter: Version.
SLA vs Completion Time Analysis (by Task and Task Owner)
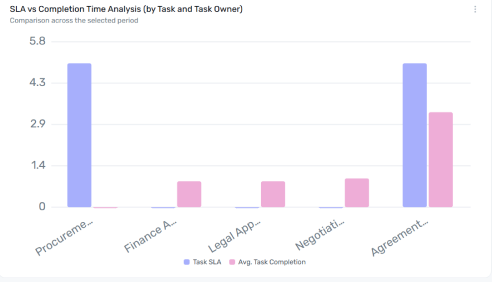
Combines both dimensions at once — task and task owner — so you can pinpoint exactly which owner is over SLA on exactly which task, rather than inferring it by cross-referencing the two reports above. Report-level filters: Version, Task, Task Owner.