Savings Dashboard Reports
Last updated: September 22, 2026
Overview
The Savings dashboard tracks savings delivered, guaranteed savings, and savings performance over time. It's under Reports → Dashboards → Savings.
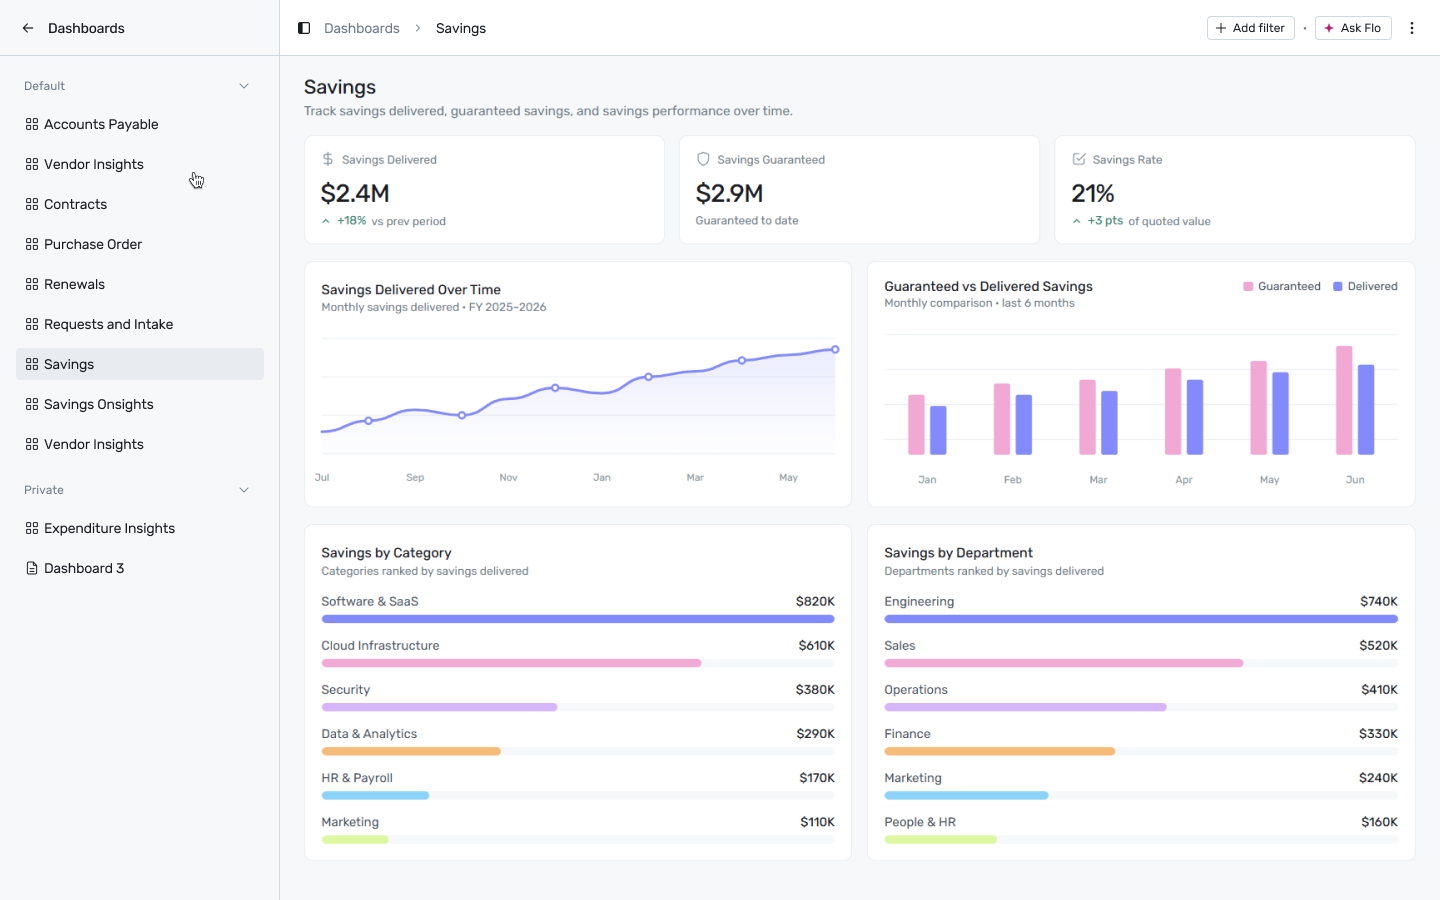
Reports → Dashboards → Savings
Filtering
Click + Add filter to narrow this dashboard by:
Date — not currently supported by any report on this dashboard.
Department — applies to Savings Delivered, Savings Rate, Savings Delivered Over Time, Guaranteed vs Delivered Savings, Savings by Category, and Savings by Department.
A filter only affects the widgets whose report declares that dimension — anything else is left unchanged.
Reports on this dashboard
Savings Delivered
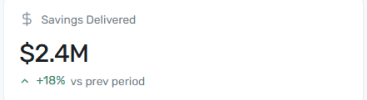
Total realized savings to date, with a trend badge against the prior period. This is money already saved, not projected — it only grows as negotiated savings are confirmed.
Savings Guaranteed
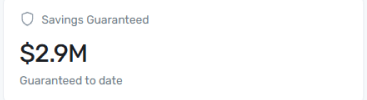
The total savings amount Spendflo has committed to deliver, to date. This is the target, not the result — pair it with Savings Delivered to see how close you are to the commitment.
Savings Rate
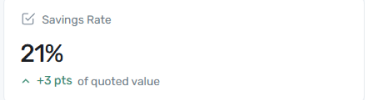
Savings delivered as a percentage of quoted value, with a trend badge. This normalizes savings performance regardless of deal size, so it's a fairer way to compare performance period over period than a raw dollar figure.
Savings Delivered Over Time
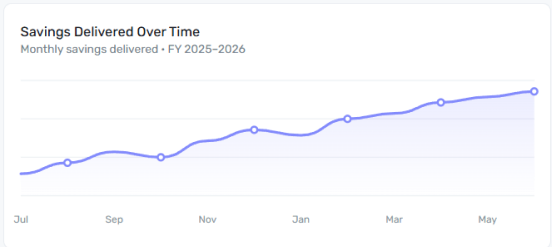
A line chart of savings delivered each month across the fiscal year. Use the trend direction rather than any single month — a steadily climbing line means savings are compounding as more deals close, not that any one month was exceptional.
Guaranteed vs Delivered Savings
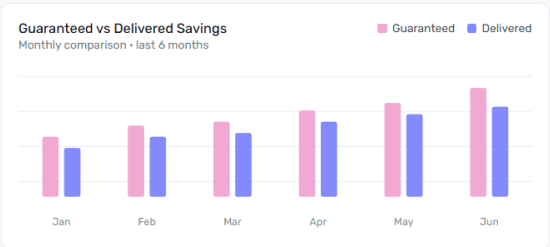
A grouped bar chart comparing guaranteed savings against delivered savings, month by month over the last six months. Where the Delivered bar is shorter than Guaranteed, that month's commitment hasn't fully materialized yet; where the two are close, you're tracking to plan.
Savings by Category
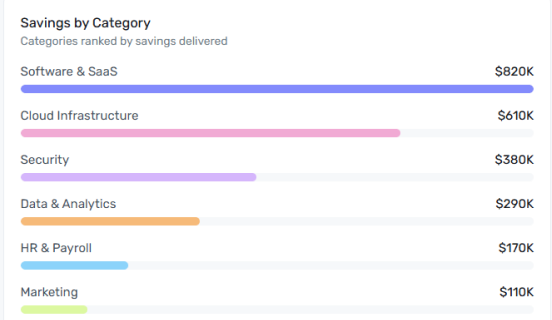
Ranks spend categories by savings delivered, highest to lowest. Use this to see where Spendflo's negotiating impact has been greatest — a category near the bottom isn't necessarily underperforming, it may simply be a smaller category overall.
Savings by Department
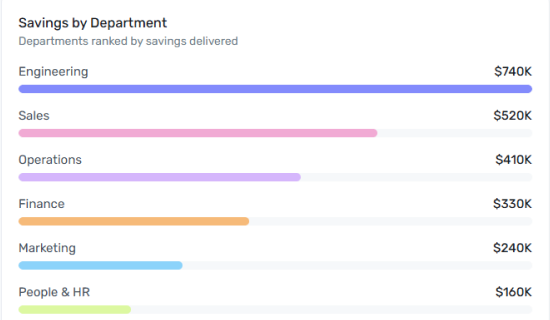
Ranks departments by savings delivered on their behalf, highest to lowest. Useful for department-level reporting — each team can see its own contribution to the organization's total savings.